Statistical Surfaces
Based on the information and data, which are organised within the database, visualisations are generated for statistical surfaces as well as for single objects and text. Visualisations are generated automatically, on the fly (those maps do not exist as images, they are created with any desired content, depending on the user's needs).
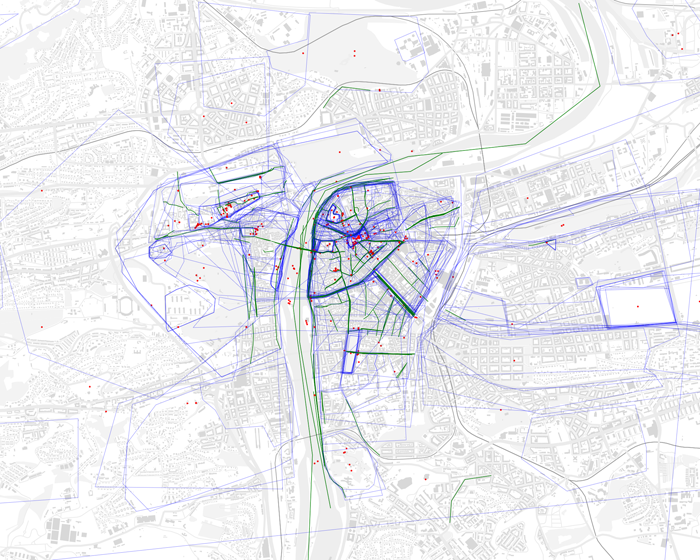
Fig. 1: Direct graphical implementation of all settings and projected places
The graphical and cartographical instruments depicted in section Single Object Maps are adequate to show individual places of action and their relation to geospace. But assuming the text corpus of a region might contain hundreds or even thousands of settings, the cartographic visualisation of every single object is not adequate and will quickly reach its limitations. Following a statistical approach, maps of the entire corpus will aim to visualise spatial distributions and the patterns those settings describe. In order to answer questions like:
- »Where and when do which landscapes and cities emerge on the literary map of Europe?«
- »Are there geographic areas that are entirely undocumented in literature?«
- »How densely populated by fictional works is a particular space?«
- »How international described is a certain region? Does it changed over time?«
- »What influences does political, historical or social changes have regarding the fictionalisation of a certain region?«
- and many more …
it will be necessary to detach the visualisation from single objects: The question, where a certain action it talking place retreated into the background for the benefit of the superior question of the 'spatial density' and its temporal changes. Statistical maps can answer questions of spatial literary centres and differentiates between literarily described space and blank, undescribed spots. Appropriate methods to calculate statistical density and visualise the literary Space are currently under development. Newest results can be followed on the page Visualisation. Figure 2 shows a early map series (also thinkable as animation) that illustrates the gradual »fictionalisation« of Lake Lucerne through several decades.
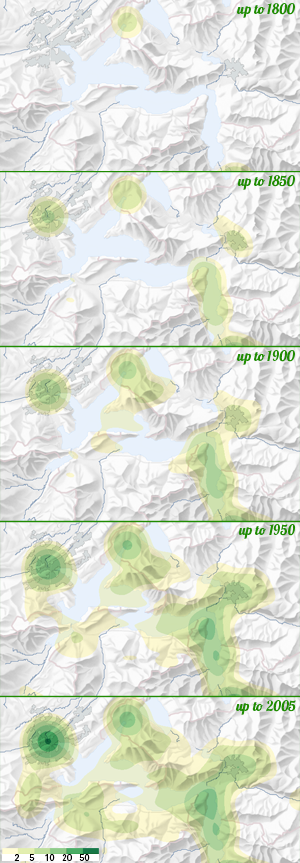
Fig. 2: Map series of the fictionalisation of the Lake Lucerne model region.